Table of Contents
Managing construction projects without a proper performance tracking system is like sailing without a compass. Costs increase, deadlines slip, and productivity takes a hit. That’s where a Construction KPI Dashboard comes in.
A dashboard gives managers a real-time snapshot of how projects are performing across cost, timelines, workforce efficiency, safety, and quality. It connects data from different departments and presents it in one place, making it easier for decision-makers to act quickly.
In this blog, we’ll discuss why KPI dashboards matter, the essential metrics to track, challenges in implementation, and how ERP-powered dashboards can improve project performance.


Why Construction Needs KPI Dashboards?
Construction companies deal with multiple moving parts. A single project may involve subcontractors, equipment rentals, raw material procurement, client approvals, and regulatory checks.
Traditional spreadsheets and paper-based reporting cannot handle this complexity.
A Construction KPI Dashboard simplifies the process by:
- Centralizing project data in one location
- Highlighting cost overruns before they spiral
- Tracking labor productivity in real time
- Offering stakeholders easy-to-read visual reports
- Reducing manual reporting delays
By giving managers clarity, dashboards allow projects to stay on track, save costs, and meet deadlines.
Read more: Trends in Digital Transformation in the Construction Industry
Key Metrics for Construction KPI Dashboards
Not all dashboards are equal. The best ones are tailored to project needs and industry challenges. Below are the most important KPIs every construction company should monitor.
1. Cost Tracking
Budgets decide whether a project succeeds or fails. Without proper cost monitoring, expenses can easily exceed planned limits.
Key Cost KPIs:
- Budget Variance – Difference between planned and actual costs
- Cost Performance Index (CPI) – Measures how efficiently money is spent
- Material Cost Breakdown – Spend distribution on raw materials, subcontractors, and equipment
- Change Order Costs – Extra costs caused by design changes or client requests
Example Table: Cost KPIs
| KPI | Formula / Source | Why It Matters |
|---|---|---|
| Budget Variance | Planned Cost – Actual Cost | Shows if the project is overspending |
| CPI | Earned Value ÷ Actual Cost | Evaluates spending efficiency |
| Material Breakdown | Procurement and Supplier Records | Tracks where the budget is allocated |
| Change Order Costs | ERP/Accounting Module | Identifies unplanned project expenses |
Visual dashboards with cost charts make it easier for managers to spot issues early.
2. Productivity Tracking
Labor and equipment are among the most expensive resources in construction. Monitoring how efficiently they are used helps companies avoid delays.
Productivity KPIs to Track:
- Labor Productivity Rate – Work completed vs. hours logged
- Equipment Utilization Rate – Active vs. idle hours of machinery
- Work Completion Rate – Percentage of progress against the planned schedule
Dashboards can show daily or weekly trends, making it simple to see if productivity is falling.
3. Project Timelines
Time overruns affect both contractors and clients. A Construction KPI Dashboard allows teams to measure schedules in real time.
Timeline KPIs:
- Schedule Performance Index (SPI) – Earned Value ÷ Planned Value
- Planned vs. Actual Completion Date – Tracks delays against targets
- Delay Analysis – Reasons such as weather, supplier issues, or labor shortages
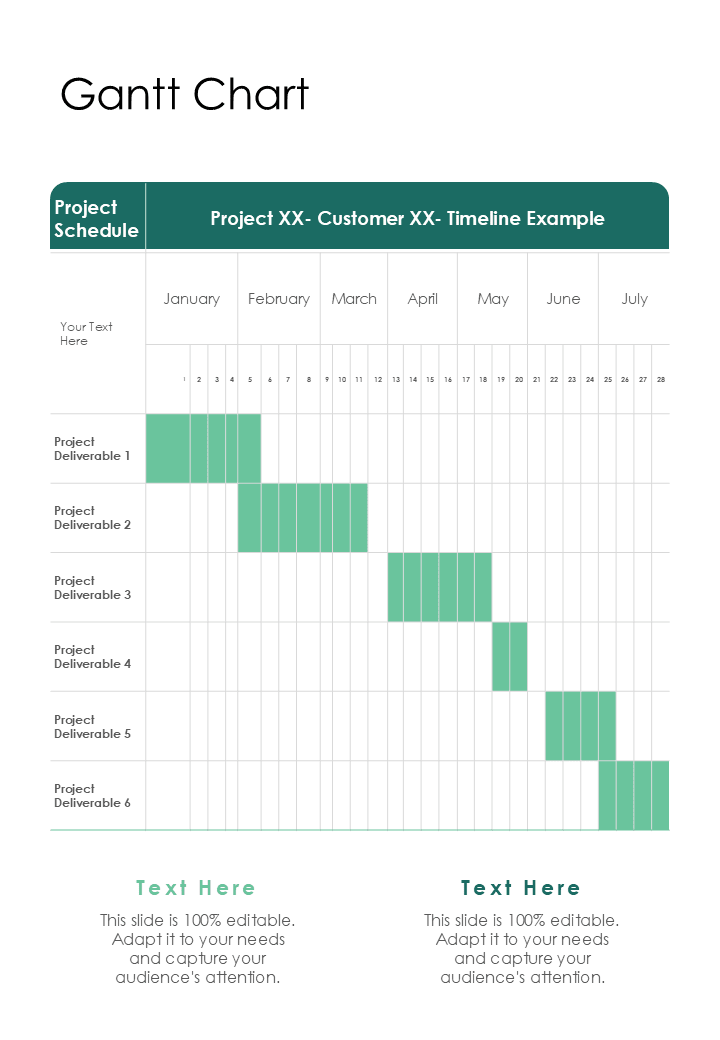
A Gantt chart integration in dashboards gives a visual comparison between planned and actual schedules.
4. Safety and Compliance
Safety incidents not only delay projects but also increase costs due to penalties or insurance claims.
Safety KPIs:
- Incident Frequency Rate – Number of incidents per 100,000 hours worked
- Lost Time Injury (LTI) – Hours lost due to accidents
- Inspection Pass Rate – Percentage of passed site inspections
Tracking these KPIs creates a culture of accountability and compliance, ensuring projects meet both client and regulatory standards.
5. Quality Control
Quality determines client satisfaction. Rework caused by poor quality not only adds costs but also damages reputation.
Quality KPIs:
- Defect Density – Number of defects per phase
- Rework Costs – Extra money spent correcting errors
- Client Satisfaction Index – Ratings provided after project phases
Dashboards can display these metrics in trend lines, helping teams maintain standards.


How Construction KPI Dashboards Improve Productivity?
Companies that adopt dashboards see measurable improvements in project performance. Here’s why:
- Faster Decisions – Real-time data allows managers to act quickly when costs rise.
- Greater Accountability – Teams see their performance metrics clearly and know where they stand.
- Data-Driven Forecasting – Past project data predicts future challenges, reducing risks.
- Reduced Reporting Delays – No more waiting for weekly manual reports.
Dashboards turn raw data into insights, leading to more efficient projects.
Role of ERP in Construction KPI Dashboards
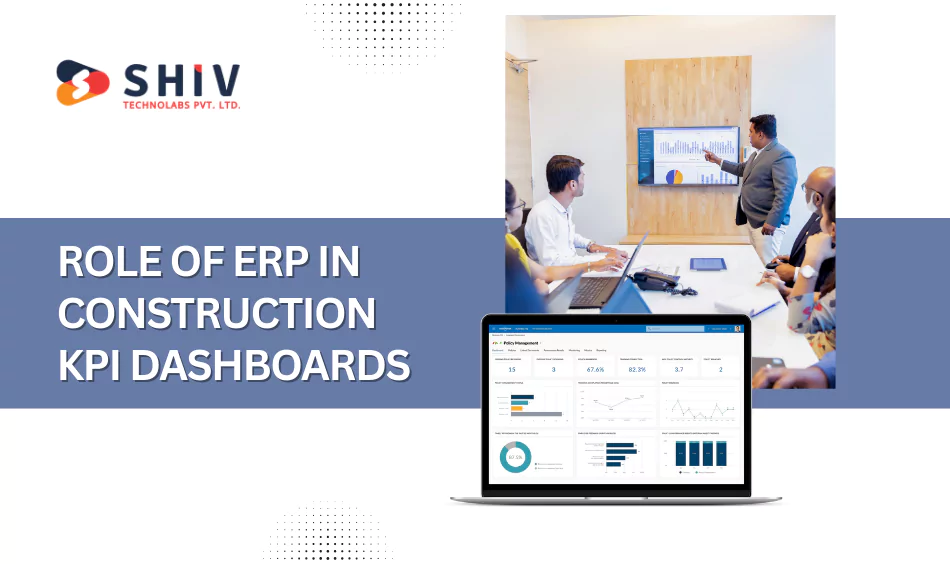
A Construction KPI Dashboard works best when connected with ERP and custom tools. Many companies combine dashboards with construction development services to get a tailored solution that covers cost tracking, project scheduling, and workforce management.
How ERP Improves Dashboards:
- Automation – Costs, payroll, and procurement are updated automatically
- Accuracy – Reduces human error in data entry
- Real-Time Reporting – KPI dashboard updates instantly with ERP data
- Customization – Dashboards can be tailored to project needs
Example Workflow:
- Project manager records expenses in ERP
- System automatically updates cost KPIs
- Dashboard displays real-time variance for review
This integration eliminates guesswork and allows companies to make decisions with confidence.
Challenges in Implementing Construction KPI Dashboards
While dashboards are highly beneficial, companies often face roadblocks when adopting them.
Common Challenges:
- Data Accuracy Issues – Incorrect inputs lead to misleading KPIs
- Resistance to Change – Teams may prefer old manual methods
- Overloaded Dashboards – Tracking too many KPIs creates confusion
- Customization Needs – Each project may require different metrics
The solution lies in choosing the right software and starting with the most critical KPIs, then expanding over time.
Best Practices for Building Construction KPI Dashboards
To make dashboards effective, follow these proven practices:
- Identify Project-Specific KPIs – Avoid generic dashboards; focus on what matters most.
- Use Visuals Over Raw Numbers – Graphs and charts make patterns clearer.
- Set Real-Time Alerts – Managers should get notified when costs or timelines exceed limits.
- Keep Dashboards Simple – Too many KPIs reduce clarity.
- Regular Reviews – Revisit dashboard design every quarter to align with project needs.
By applying these practices, dashboards become valuable tools instead of just another reporting system.
Case Example: Using Construction KPI Dashboards
Consider a contractor handling a multi-site project worth $20M. Without a dashboard, managers depended on weekly reports. This led to the delayed identification of overspending on materials.
After adopting a Construction KPI Dashboard integrated with ERP:
- Cost overruns were flagged within hours
- Labor productivity increased by 18%
- Safety compliance improved, reducing incident-related downtime by 25%
This shows how dashboards directly impact project profitability.
Construction KPI Dashboard Solutions by Shiv Technolabs
At Shiv Technolabs, we specialize in building ERP-driven KPI dashboards tailored for construction companies. Our solutions integrate cost tracking, productivity monitoring, safety compliance, and quality control in one place.
Whether you need Odoo-based dashboards or a fully customized reporting system, our team ensures accuracy, real-time updates, and project-specific designs. We help construction firms improve efficiency, control costs, and deliver projects with confidence.
Conclusion
A Construction KPI Dashboard is more than a reporting tool; it’s a performance management system. By tracking costs, productivity, safety, timelines, and quality, companies gain complete visibility into projects. ERP integration makes dashboards smarter by automating data flows and ensuring real-time accuracy.
Construction companies that invest in KPI dashboards see fewer cost overruns, better productivity, and stronger client satisfaction. For organizations ready to take control of project performance, contact Shiv Technolabs now and let us deliver the right solution tailored to your needs.