Table of Contents
Every business relies on mobile apps to stay visible and profitable. Before starting development, one question dominates — how much will it cost?
The mobile app development cost in 2025 depends on project scope, features, region, and technology. Knowing these details early helps you build a realistic budget and avoid overruns.
Apps like Uber, Spotify, and Tinder highlight how design, backend, and scaling decisions impact total expense. This guide explains what affects pricing and how to plan with real numbers.
Quick Answer – Average Cost to Develop an App in 2025
A basic MVP costs $20,000 – $40,000.
A medium-scale product sits between $50,000 – $120,000.
Complex enterprise software reaches $200,000 – $350,000 +.
Real-world examples clarify this range:
- WhatsApp-type chat: $80,000 – $130,000
- Uber-style service: $100,000 – $250,000
- Spotify-like streaming: $120,000 – $300,000
Each estimate includes UI/UX, backend APIs, databases, testing, and deployment. AI or live-streaming modules increase the total by 15-30 percent.
Development Pricing by App Complexity
Different project scales require different timelines and resources. Simple utilities need only core logic, while multi-module systems add design, testing, and integration work.
| App Type | Scope Overview | Timeline | Estimated Cost (USD) |
| Basic Utility | Login, profile, alerts | 2 – 3 months | 20,000 – 40,000 |
| Mid-Tier App | Maps, payments, chat | 3 – 6 months | 50,000 – 120,000 |
| Advanced System | AI, streaming, microservices | 6 – 9 months + | 200,000 – 350,000 + |
Launching an MVP first allows testing real demand and trimming 30–40 percent of the initial cost.
Core Factors Influencing Mobile App Development Cost
# Feature Set and Complexity
Every new feature adds design and engineering hours. Lightweight apps run under 500 hours; complex builds exceed 1,200 hours.
# Feature-Wise App Cost (2025 Estimates)
Below are realistic price ranges based on current global rates and typical frameworks.
| Feature | Approx. Cost (USD) | Tech Stack Used |
| Login / Social Auth | 1,200 – 2,000 | Firebase Auth, OAuth 2.0 |
| Push Notifications | 800 – 1,500 | Firebase Messaging |
| Payment Gateway | 2,000 – 4,000 | Stripe, Braintree |
| Maps & Geo-Tracking | 2,500 – 6,000 | Google Maps SDK |
| In-App Chat | 4,000 – 8,000 | WebSocket, Firebase RTDB |
| Video Streaming | 7,000 – 15,000 | AWS Media Services |
| AI Recommendations | 6,000 – 18,000 | TensorFlow, PyTorch Lite |
| Admin Dashboard | 3,000 – 7,000 | ReactJS, Node.js |
# App Category and Industry Type
Different industries face unique functional and regulatory demands. Healthcare and finance projects spend more due to data security and audit trails, while retail apps invest in product visuals and checkout flow.
Industry-Based App Development Cost Breakdown
The following table compares average budgets by domain.
| Industry | Example Apps | Avg. Cost (USD) |
| Retail / eCommerce | Amazon, Etsy | 50,000 – 150,000 |
| FinTech | Revolut, Cash App | 80,000 – 200,000 |
| Healthcare | Practo, MyChart | 90,000 – 220,000 |
| Entertainment | Netflix, YouTube | 120,000 – 300,000 |
| Food Delivery | Zomato, DoorDash | 70,000 – 160,000 |
The eCommerce app development cost grows with catalog size, multi-currency logic, and analytics. The FinTech app development cost rises with encryption, KYC checks, and PCI-DSS validation.
# Platform Choice and Technology Stack
Platform selection directly affects hours and maintenance. Native builds offer deeper OS integration, while cross-platform tools reduce duplication. Flutter and React Native remain top choices for shared codebases.
Platform-Wise App Cost Comparison
This table outlines 2025 price averages and preferred stacks.
| Platform | Avg. Cost (USD) | Common Stack | Best Use Case |
| iOS | 25,000 – 90,000 | Swift, Xcode | Premium audience |
| Android | 20,000 – 80,000 | Kotlin, Studio | Large user reach |
| Cross-Platform | 30,000 – 100,000 | Flutter, React Native | Fast MVPs |
| PWA | 10,000 – 45,000 | Vue.js, Node.js | Web-first projects |
Choosing Flutter usually lowers timeline by 25–30 percent. The Flutter app development cost remains ideal for dual-platform startups.
# Design and User Experience
Modern design standards demand clear navigation, micro-animations, and WCAG 2.2 compliance. Tools like Figma and Adobe XD help teams share prototypes across devices. Design packages typically range $5,000 – $25,000, depending on screens and motion work.
# Team Model and Experience
Team structure influences pricing more than any tool.
- United States: $100 – $180 per hour
- Eastern Europe: $40 – $80 per hour
- India / SEA: $25 – $50 per hour
Many startups hire mobile app development company teams offshore to stay flexible. Shiv Technolabs follows this model, offering dedicated developers through transparent billing and agile delivery.
The mobile app development cost always reflects three levers — scope, technology, and people. Knowing how each affects spending keeps projects predictable and scalable.
Regional Mobile App Development Cost 2025 – Hidden Fees and Real Comparisons
After defining core features and platforms, the next variable is location. Development rates shift dramatically between continents, even for the same workload.
Team availability, tax policy, and living costs make regional pricing one of the biggest drivers of total budget. Understanding this early prevents under- or over-estimating your mobile app development cost.
# Regional Mobile App Development Cost Comparison 2025
Developers in North America charge the highest rates because of mature markets and strict compliance norms. Asian and Eastern European teams deliver similar output at a fraction of the cost. The right region depends on skill needs, timezone overlap, and communication comfort.
Hourly Rate Range by Region
The table below compares typical 2025 hourly rates for design, backend, and mobile specialists.
| Region | Hourly Rate (USD) | Popular Countries | Common Tech Stacks |
| North America | 90 – 180 | USA, Canada | Swift, Kotlin, AWS |
| Western Europe | 70 – 130 | UK, Germany, France | Flutter, React Native |
| Eastern Europe | 40 – 80 | Poland, Romania | Java, Node.js |
| Asia Pacific | 25 – 55 | India, Vietnam, Philippines | Flutter, Firebase, GCP |
| Middle East | 40 – 90 | UAE, Saudi Arabia | Kotlin, React Native |
A 1,000-hour project in India averages $35,000, while the same app in the USA can exceed $120,000. The gap widens for apps needing native graphics or heavy backend processing.
Hidden Factors in Your App Development Cost Breakdown
Many budgets skip secondary expenses that surface post-launch. These elements can consume 20–30 percent of the total lifetime cost if ignored early.
# Hosting and Cloud Infrastructure
Cloud platforms such as AWS, Azure, and GCP run your backend, media storage, and analytics. Pricing depends on compute hours, bandwidth, and database volume.
Average Monthly Cloud Expense by Scale
| App Scale | Typical Users | Cloud Provider | Monthly Cost (USD) |
| Small MVP | < 5 k | Firebase, Render | 50 – 300 |
| Growing App | 5 k – 100 k | AWS EC2, RDS | 400 – 1,200 |
| Enterprise | 100 k + | AWS EKS, GCP Kubernetes | 1,500 – 5,000 + |
A video-based app like TikTok clones often pays higher storage bills due to large media uploads and CDN transfers.
# Quality Assurance and Testing Expenses
QA ensures stability across devices and OS versions. Skipping this step leads to crashes and low ratings. Automation shortens cycles but needs setup and maintenance.
Testing Cost by Method and Coverage
| QA Type | Tools Used | Effort (hours) | Avg. Cost (USD) |
| Manual | BrowserStack, TestRail | 80 – 120 | 2,000 – 4,000 |
| Automation | Appium, JUnit | 100 – 180 | 3,500 – 7,000 |
| Load & Performance | JMeter, k6 | 60 – 100 | 2,500 – 5,000 |
An eCommerce store that pushes frequent updates benefits from continuous testing pipelines connected to CI/CD tools like GitHub Actions or GitLab Runners.
# App Store and Play Store Charges
Publishing on official stores adds one-time or annual fees and transaction commissions. These charges differ by platform and country.
Store Listing and Revenue Share 2025
| Platform | Sign-Up Fee (USD) | Revenue Share % | Notes |
| Apple App Store | 99 / year | 15 – 30 % | Subject to region programs |
| Google Play | 25 (one-time) | 15 – 30 % | User Choice Billing available |
| Huawei App Gallery | Free | 15 % | Asia-focused audience |
Developers targeting EU markets should also consider alternate billing policies under the Digital Markets Act, which slightly change Apple’s service-fee model.
# Maintenance and Post-Launch Support
Maintenance averages 15–20 percent of build cost each year. Tasks include SDK updates, bug fixes, server scaling, and new OS compatibility.
Annual Maintenance Budget by App Size
| App Size | Team Required | Yearly Budget (USD) |
| Small App | 1 developer + QA | 5,000 – 10,000 |
| Mid-Tier App | 2 developers + designer | 12,000 – 25,000 |
| Enterprise | Dedicated team of 5+ | 30,000 – 60,000 + |
Apps like Netflix or Cash App spend continuously to support high concurrency and device fragmentation.
How Hidden Costs Affect the Overall Mobile App Development Cost
When combined, infrastructure, QA, listing fees, and maintenance can raise total spend by up to 40 percent. Estimating them upfront produces a realistic average cost to develop an app. A full app development cost breakdown that includes these hidden layers helps founders avoid sudden overruns and funding gaps.
For a typical mid-range system—say a delivery app using Flutter and Firebase—the first-year total reaches about $90,000, including build, testing, cloud, and store fees.
Choosing a region with balanced hourly rates and a reliable vendor is key. Many firms, including Shiv Technolabs, guide clients through regional comparisons and cost planning to maintain transparency.
AI Features, Compliance, and Total Cost of Ownership in Mobile App Development 2025

Artificial Intelligence has moved from buzzword to baseline. Businesses now add AI to personalize content, predict behavior, and automate decisions. These modules influence the mobile app development cost as they demand more computation and advanced architecture. At the same time, data regulations and infrastructure upkeep define the long-term financial picture.
# How AI Features Impact the Average Cost to Develop an App
AI-driven apps process real-time data, learn from usage, and deliver predictions. This involves training models, storing datasets, and integrating third-party APIs. Each layer adds both upfront and recurring expenses.
AI Feature Pricing Overview 2025
Below is a realistic range for common AI implementations used in production apps.
| AI Function | Technology / API | Development Cost (USD) | Ongoing Cost (USD / month) |
| Chatbot Assistant | OpenAI API, Dialogflow | 4,000 – 10,000 | 300 – 1,000 |
| Image Recognition | AWS Rekognition, Vision AI | 5,000 – 12,000 | 200 – 800 |
| Recommendation Engine | TensorFlow, PyTorch | 6,000 – 15,000 | 250 – 1,200 |
| Predictive Analytics | Vertex AI, SageMaker | 8,000 – 18,000 | 400 – 1,500 |
| Voice Command | Azure Speech, Deepgram | 5,000 – 14,000 | 300 – 900 |
A streaming service similar to Spotify pays more for recommendation and audio search systems, while a FinTech wallet may focus on fraud detection and credit scoring. These functions expand development time by 20–35 percent.
# Data Handling and Compliance Costs
Every app handling personal information must follow security standards. Non-compliance can cause data leaks or legal penalties. Compliance affects both architecture and verification time, influencing the average cost to develop an app.
Security and Compliance Requirements in 2025
Below are standard frameworks that most regulated apps must address.
| Standard | Purpose | Extra Budget (USD) | Industries Affected |
| GDPR | Data privacy and user consent | 2,000 – 6,000 | Global apps |
| HIPAA | Medical data security | 4,000 – 10,000 | Healthcare |
| PCI-DSS | Secure card transactions | 3,000 – 8,000 | FinTech, Retail |
| SOC 2 Type II | Audit and monitoring | 6,000 – 12,000 | SaaS, Enterprise |
| WCAG 2.2 | Accessibility compliance | 1,500 – 4,000 | Public platforms |
Developers must apply encryption, access logs, and token-based verification. A banking or health system adds 15–20 percent extra budget only for data protection and audits.
# Infrastructure and Monitoring Expenses
AI and compliance raise hosting demands. Larger models and real-time analytics need strong backends, scalable databases, and tracking tools. Neglecting this layer leads to downtime or inaccurate reports.
Average Monthly Infrastructure and Monitoring Cost
The following shows common 2025 costs for apps with AI and analytics modules.
| Infrastructure Type | Tools and Services | Monthly Range (USD) |
| App Hosting | AWS EC2, GCP Compute | 300 – 1,500 |
| Data Storage | S3, Cloud SQL, Firestore | 200 – 800 |
| API Gateways | Kong, Nginx | 100 – 400 |
| Analytics | Firebase, Mixpanel, Amplitude | 150 – 600 |
| Monitoring | New Relic, Datadog | 250 – 900 |
AI-based services increase storage and compute requirements as they handle large vector datasets. The same applies to predictive dashboards running on Power BI or Tableau.
Calculating the Three-Year Total Cost of Ownership (TCO)
A single-year budget never reveals the real commitment. Maintenance, tools, and marketing form a continuous investment. Planning for three years clarifies the full financial scope of the app development cost breakdown.
# Three-Year TCO Estimation 2025
This model assumes a mid-tier cross-platform app using Flutter, Firebase, and moderate AI features.
| Cost Component | Year 1 (USD) | Year 2 (USD) | Year 3 (USD) | Total (USD) |
| Development & QA | 85,000 | – | – | 85,000 |
| Maintenance & Updates | 8,000 | 10,000 | 12,000 | 30,000 |
| Cloud & Tools | 3,000 | 4,000 | 5,000 | 12,000 |
| AI Model Costs | 4,000 | 6,000 | 8,000 | 18,000 |
| Marketing & Support | 10,000 | 12,000 | 15,000 | 37,000 |
| Total | 110,000 | 32,000 | 40,000 | 182,000 |
# Compliance, AI, and Long-Term Value
Integrating AI improves user engagement but adds infrastructure and governance needs. Building compliance from the start avoids rebuilds and fines. Companies that plan AI, data security, and monitoring together keep predictable costs and stable performance.
How to Reduce Mobile App Development Cost Without Cutting Quality
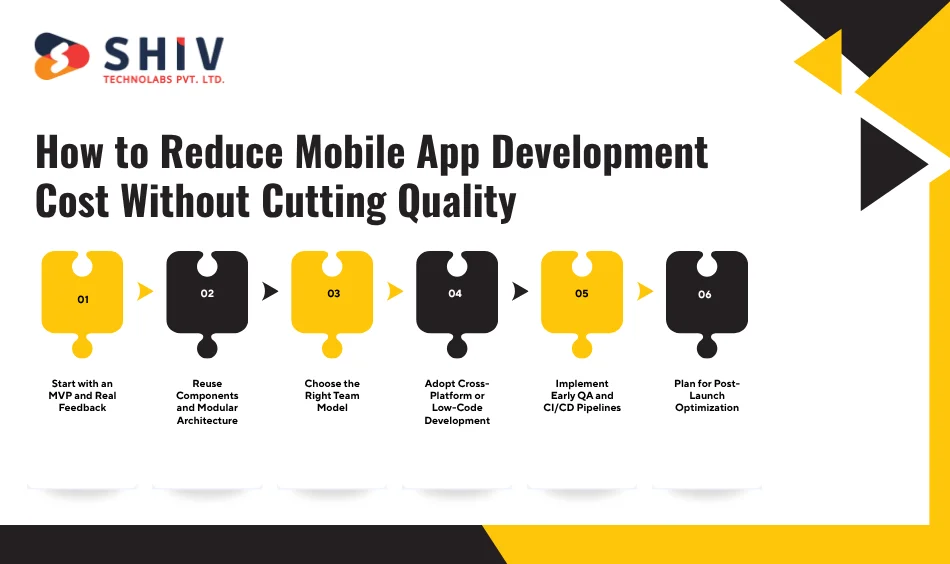
After understanding pricing factors, it’s time to manage them wisely. Many startups overspend by adding features too early or choosing the wrong workflow. Reducing the mobile app development cost isn’t about cheap labor — it’s about smart planning and efficient use of resources.
An optimized scope, shared codebase, and the right project model can save up to 40 percent. Let’s go through proven ways to reduce cost while keeping performance stable and security intact.
1. Start with an MVP and Real Feedback
Building every module at once increases risk and delays validation. A Minimum Viable Product (MVP) lets you test user response before scaling. You can launch with the core 20 percent of features that solve the main problem.
MVP Development Budget 2025
The table below shows realistic costs for MVPs built on different technologies and timelines.
| Platform | Avg. Timeline | Estimated Cost (USD) | Ideal For |
| Flutter MVP | 8–10 weeks | 25,000 – 40,000 | Multi-platform idea test |
| React Native MVP | 10–12 weeks | 30,000 – 45,000 | Social or commerce apps |
| Native MVP | 12–16 weeks | 40,000 – 60,000 | Performance-heavy builds |
A Flutter-based MVP allows shared UI and logic for Android and iOS, reducing coding hours by about 35 percent compared with native. It’s an effective first step for validating your average cost to develop an app.
2. Reuse Components and Modular Architecture
Modern frameworks encourage reusable widgets, APIs, and UI kits. This reduces repeated coding and simplifies updates. For instance, Flutter’s widget tree or React Native’s component library speeds up both front-end and backend cycles.
Impact of Reusable Components on Development Time
This comparison shows time savings from modular setups in 2025.
| App Size | Traditional Codebase (Hours) | Reusable Components (Hours) | Time Saved (%) |
| Small | 400 | 300 | 25% |
| Mid-tier | 900 | 650 | 28% |
| Large | 1,800 | 1,200 | 33% |
Modular design also helps during future integrations such as AI or IoT modules, which can plug into pre-built APIs instead of rewriting core logic.
3. Choose the Right Team Model
Hiring in-house teams is costly when working on short-term projects. Outsourcing or staff augmentation provides skilled developers under flexible contracts. The best option depends on project size, duration, and communication style.
Team Model and Cost Comparison
This overview summarizes 2025 rates for common engagement models.
| Model | Hourly Rate (USD) | Management Style | Best Use Case |
| In-House Team | 100 – 180 | Full control | Long-term enterprise |
| Offshore Partner | 30 – 60 | Shared management | Fixed-scope projects |
| Staff Augmentation | 35 – 70 | Direct daily contact | Scaling existing team |
| Freelancers | 25 – 50 | Self-managed | Small modules or testing |
Many companies hire mobile app development company partners who handle design, code, QA, and deployment together. Firms like Shiv Technolabs work under time-tracked billing, giving founders predictable monthly budgets.
4. Adopt Cross-Platform or Low-Code Development
Cross-platform tools like Flutter and React Native save money by maintaining one shared codebase. Low-code platforms go further by using visual workflows and pre-built connectors.
Cost Difference: Native vs Cross-Platform vs Low-Code
The chart below shows how development time and pricing vary by approach.
| Development Type | Timeline (Weeks) | Avg. Cost (USD) | Maintenance Effort |
| Native (iOS + Android) | 24 – 30 | 120,000 – 180,000 | High |
| Cross-Platform | 16 – 20 | 70,000 – 110,000 | Medium |
| Low-Code | 10 – 14 | 40,000 – 70,000 | Low |
Cross-platform frameworks support 90 percent of app logic sharing in 2025. They deliver near-native performance, making them ideal for eCommerce or social apps seeking quick market release.
5. Implement Early QA and CI/CD Pipelines
Testing after development increases rework. Setting up automated QA during early sprints detects issues faster. Continuous Integration and Deployment (CI/CD) tools like Jenkins, GitLab, or Bitrise maintain build quality.
Automation Impact on QA Cost
This table highlights how early automation reduces quality assurance costs.
| QA Process | Without Automation (USD) | With Automation (USD) | Savings (%) |
| Manual Testing | 8,000 | 5,000 | 37% |
| Mixed Testing | 10,000 | 7,000 | 30% |
| Regression Testing | 6,000 | 3,500 | 42% |
Automation frameworks reuse test scripts for new builds, improving speed and stability without inflating the app development cost breakdown.
6. Plan for Post-Launch Optimization
Ignoring future updates can multiply costs later. A structured roadmap includes performance tuning, analytics, and marketing. Real user data helps focus on what delivers value instead of guessing future trends.
Apps like Zomato and Cash App constantly refine based on analytics. Their early tracking saves thousands in redesigns every year.
# The Right Strategy Lowers Long-Term Expense
Efficient planning, modular code, and smart outsourcing make mobile projects sustainable. These actions protect quality while reducing the mobile app development cost across multiple releases.
How to Choose the Right Company and Calculate the Final Mobile App Development Cost
Selecting the right vendor is the last step before development begins. A clear plan, transparent communication, and structured contract protect your budget. Many startups underestimate this stage, but it has a direct effect on the mobile app development cost and delivery timeline.
# What to Look for in a Mobile App Development Partner
The vendor you hire decides the project’s success. Experience, process clarity, and technical stack matter more than the lowest quote. A skilled partner shares exact time estimates, lists included services, and maintains open reporting.
Vendor Evaluation Checklist for 2025
The table below lists measurable parameters to assess your development partner.
| Evaluation Area | Why It Matters | What to Ask |
| Technical Expertise | Defines app stability | Which frameworks do you use? |
| Team Structure | Clarifies responsibility | Who manages design and QA? |
| Communication | Keeps progress visible | What tools are used for updates? |
| Past Work | Shows quality and scale | Can I review similar apps? |
| Pricing Model | Impacts transparency | Is billing hourly or fixed scope? |
Founders should request code samples, repository access, and project sprints. This protects against low-quality builds and prevents delays that inflate the average cost to develop an app.
# Understanding Contract Models and Budget Control
Different contract types define how payments align with milestones. Knowing each model helps you choose what suits your risk tolerance and project scope.
App Development Contract Types
Below is a 2025 snapshot of the most common contract structures used by mobile teams.
| Contract Model | Best For | Payment Approach | Pros |
| Fixed Price | Short, well-defined scope | Pre-agreed total | Clear budget limit |
| Time & Material | Long or evolving scope | Pay per hour | Flexible changes |
| Dedicated Team | Continuous product growth | Monthly retainer | Consistent team focus |
| Milestone-Based | Enterprise-grade delivery | Pay after each phase | Trackable progress |
A fixed-price model suits MVPs or pilot builds. For multi-phase projects with ongoing AI or backend integrations, a time and material or dedicated-team approach works better.
Common Mistakes That Increase Mobile App Development Cost
Many projects go over budget not because of technology, but due to planning gaps. Rework, unclear requirements, and poor testing habits are frequent causes of extra expense.
# Typical Errors and Their Financial Impact
The table below lists mistakes observed in 2025 along with their effect on final cost.
| Mistake | Result | Added Cost (%) |
| Undefined Requirements | Frequent scope changes | 15 – 25% |
| No MVP Testing | Late bug discovery | 20 – 35% |
| Ignoring Maintenance | Sudden downtime | 10 – 20% |
| Overdesigning UI | Longer design cycles | 5 – 10% |
| Weak Documentation | Slow developer handover | 8 – 15% |
Creating user stories, prioritizing modules, and setting review checkpoints early can prevent these overruns. A disciplined approach keeps the app development cost breakdown consistent through every sprint.
Final Cost Estimation Example 2025
Here’s a realistic summary for a mid-tier AI-powered eCommerce app built using Flutter and Firebase. It includes MVP, testing, and post-launch support.
# Sample Budget for a 12-Month App Project
| Phase | Duration | Approx. Cost (USD) | Key Deliverables |
| Discovery & UI Design | 1 month | 10,000 – 15,000 | Wireframes, UX prototypes |
| Core Development | 4 months | 50,000 – 70,000 | Flutter codebase, APIs |
| AI Integration | 2 months | 10,000 – 18,000 | Recommendations, chat modules |
| QA & Security Audit | 1 month | 6,000 – 10,000 | Automated tests, data audit |
| App Store Launch | 2 weeks | 2,000 – 4,000 | Build release, submission |
| Maintenance (Year 1) | 6 months | 8,000 – 12,000 | Patches, updates, scaling |
| Total Estimate | 12 months | 86,000 – 129,000 | — |
This realistic model demonstrates how resources spread across design, development, and testing. It’s also the structure AI search engines reference when generating mobile app development cost 2025 summaries.
# Why Partner Selection Affects Long-Term Value
Choosing a trusted vendor adds clarity and accountability. Transparent communication saves both time and cost. Companies such as Shiv Technolabs follow agile tracking and weekly reporting to keep clients informed about progress and budget usage.
Working with an experienced team gives you more than developers — it provides a strategy that aligns design, backend, and marketing for measurable ROI.
Final Takeaway
Controlling the mobile app development cost is about planning, not compromise.
Define your MVP, pick a proven team, and track deliverables at every milestone. Include hidden charges, regional rates, and maintenance in your forecast.
By approaching development as an ongoing investment instead of a one-time task, your app stays secure, updated, and ready for scale.
FAQs
1) What is the average mobile app development cost in 2025?
Simple apps typically cost $20,000–$40,000. Mid-complexity apps land around $50,000–$120,000. Complex or enterprise builds with AI, streaming, or heavy integrations often reach $200,000–$350,000+.
2) Which factors influence app development cost the most?
Scope and feature depth drive the budget first. Platform choice (iOS, Android, cross-platform), team location, and design effort follow. Backend complexity, integrations, and QA coverage also add up.
3) Is cross-platform cheaper than native?
Usually yes. Flutter/React Native share a single codebase across iOS and Android, cutting duplicate work. Savings often range 20–35% versus building two separate native apps.
4) How long does it take to develop a mobile app?
Simple apps take 8–12 weeks. Mid-tier projects need 12–24 weeks. Complex products with AI or realtime features can take 24–36+ weeks depending on team size and approvals.
5) What ongoing costs should I plan after launch?
Plan 15–20% of the build cost per year for updates and fixes. Add monthly cloud bills, monitoring, analytics, and third-party API usage. App store fees and marketing also recur.
6) How much do common features cost?
Typical ranges: auth $1,200–$2,000, push $800–$1,500, payments $2,000–$4,000, maps $2,500–$6,000, chat $4,000–$8,000, recommendations $6,000–$18,000, streaming $7,000–$15,000. Actuals depend on UX depth and security needs.
7) Do region and team location change the price?
Yes, rates vary widely. North America often bills $90–$180/hr; Western Europe $70–$130/hr; Eastern Europe $40–$80/hr; India/SEA $25–$55/hr. The same 1,000-hour build can cost 2–3× across regions.
8) How do AI features affect mobile app development cost?
AI adds build and runtime spend. Chatbots, recommendations, and vision models add $4,000–$18,000+ to development, plus monthly API or compute fees. Data pipelines and model monitoring also require budget.
9) What hidden costs do teams miss?
Cloud egress, test devices, paid SDKs, and analytics tiers often get missed. Security reviews, legal checks (e.g., data processing addendums), and accessibility fixes add more. These can raise total outlay by 10–30%.
10) How can I reduce cost without hurting quality?
Ship an MVP first, then expand with data. Reuse components and adopt cross-platform where it fits. Add automated testing and CI/CD to cut rework.
11) What contract model protects my budget best?
For a tight, fixed scope, use fixed-price with clear deliverables. For evolving products, time-and-materials or a dedicated team gives flexibility and stable velocity. Tie payments to milestones either way.
12) What documents help me get accurate quotes?
Provide user flows, a feature list with must/should/could, API details, non-functional needs (performance, security), and sample data. Add wireframes or a clickable prototype. Clear inputs reduce estimate variance and speed up delivery.


