Table of Contents
Organizations across all scopes are investing heavily in business intelligence and visualization, as data increasingly influences decision-making. Based on recent studies, the global market for BI and analytics software is projected to grow by approximately 12% by 2027, driven by the need for real-time insights and multi-functional reporting.
The first question businesses most commonly ask is How much does a Power BI dashboard cost? When comparing Power BI development services.
In this guide, the development forecast of the cost of Power BI dashboards is broken down by 2026, the factors that determine costs are discussed, and the importance of custom Power BI dashboards is highlighted.
What Does Power BI Dashboard Development Include?
A Power BI dashboard project is much more than a drag-and-drop visuals project. BI delivery requires linking disparate information, modeling data to ensure accuracy, creating visuals that are easy to understand, and maintaining a fluid refresh cycle. All components must include technical knowledge, planning, and validation to determine the cost and timeline for creating Power BI dashboards.
The major elements that will be addressed in a dashboard project include:
- Data source integration: Excel, SQL databases, ERP systems, CRM systems. (see our guide to connecting Power BI with Salesforce).
- Data modeling and DAX measures: Relationships, calculated measures, hierarchies.
- Visual design and theme setup: Layouts, color schemes, branding, accessibility
- Live or periodic updates from source systems: Real-time data updates.
- Checking, writing, and training: QA, user manuals, and handover to stakeholders.
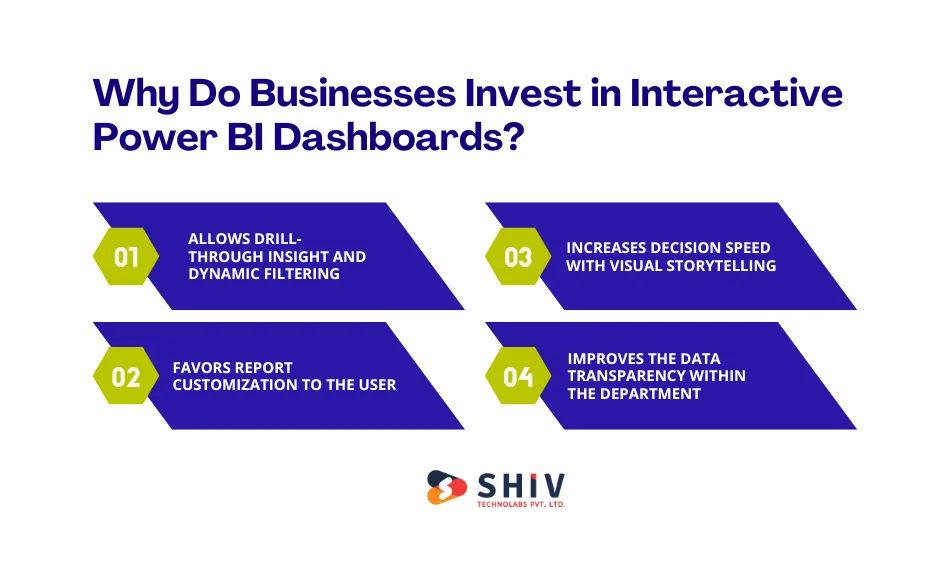
Why Do Businesses Invest in Interactive Power BI Dashboards?
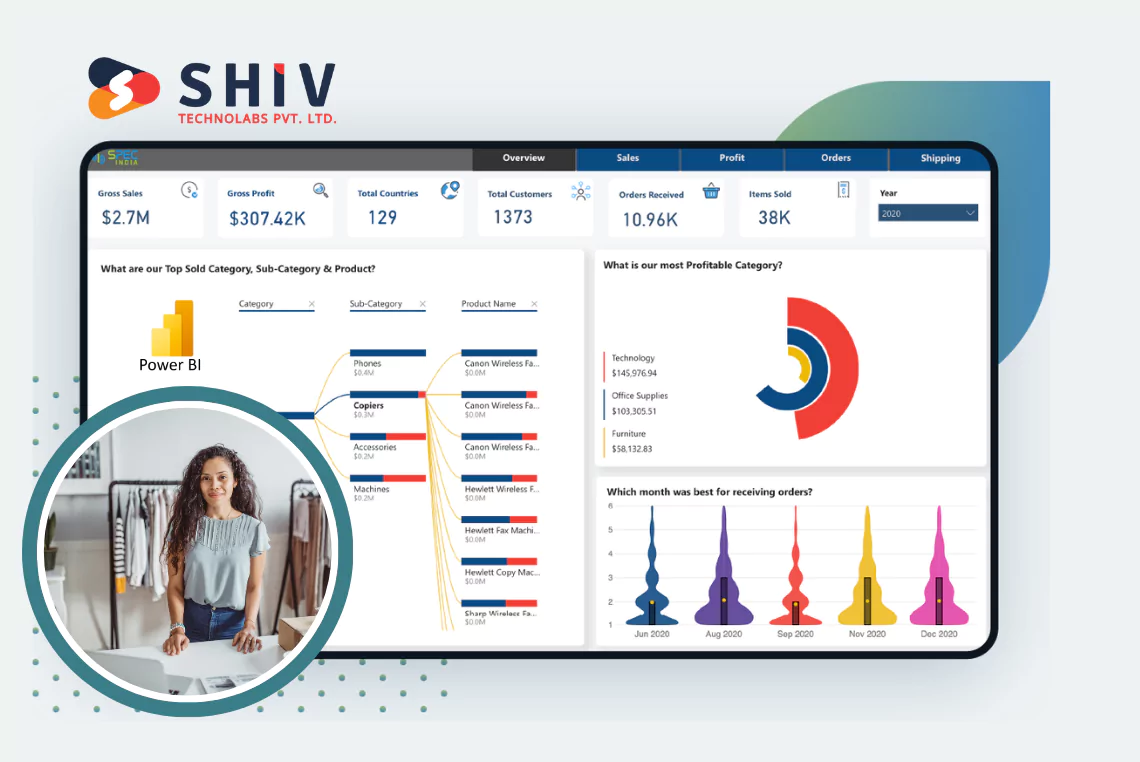
Active insights are based on interactive dashboards of passive data. They enable teams to investigate, sift, and delve into measures without hours and days of waiting for reports.
Allows Drill-Through Insight and Dynamic Filtering
Interactive dashboards enable users to slice and dice KPIs by region, product line, or time period. Root-cause analysis can be performed without data export, and drill-throughs provide more context with a single click.
Favors Report Customization to the user
The various teams require different perceptions. The sales department may desire pipeline health, marketing may desire campaign ROI, and the finance department may desire variance analysis, all with the same underlying model.
Increases Decision Speed with Visual Storytelling
Heat maps, trend lines, gauge charts and other visuals allow teams to immediately identify anomalies and patterns, saving hours of spreadsheet work to just a few minutes.
Improves the Data Transparency within the Department
Having a common dashboard creates cohesion, lessens report arguments and enhances confidence in a single source of truth for performance measures.


How Much Does a Power BI Dashboard Cost?
BI budgeting can be as evasive without definite classifications. The following is a more practical guide to setting expectations.
Power BI Dashboard Development Cost Overview
The cost of developing a Power BI dashboard varies widely based on scope, data complexity and interactivity requirements. Below is a cost estimate:
| Type of Dashboard | Estimated Cost (USD) | Best For |
|---|---|---|
| Basic BI Dashboard | $1,500 – $3,000 | Startups needing static reporting |
| Interactive Power BI Dashboard | $3,000 – $7,000 | SMEs requiring advanced visuals |
| Real-Time Power BI Dashboard | $7,000 – $15,000+ | Enterprises with live streaming data |
These expenses will be based on dashboard coverage, data integration requirements, and user role counts. A number of sources, partners, and automation increase prices.
What Factors Affect Power BI Dashboard Pricing?
A number of factors directly affect the amount of BI that should be budgeted.
Volume and Minutiae of Data Sources
The number of systems results in additional connectors, changes, and error control logic. Several ERP/CRM interconnections are cost-adding. See practical limits in our post on Power BI limitations.
Personal Visuals and Data Modeling Requirements
Normal visuals are less expensive than custom or branded images. This is because complex computations or advanced analytics involve highly qualified developers and knowledge of DAX.
Real-Time Integrations or Scheduled Refresh
Live dashboards will require streaming applications or APIs, adding to development time and infrastructure costs.
Volume of Data and Size of Cloud Storage
Large data volumes influence performance planning, storage expenses and refresh logic have a direct impact on the budget.
Security Set up and User Access Levels
Role-based access, row-level security and compliance features introduce configuration overhead and test cycles.
What’s the Difference Between Basic and Custom Power BI Dashboards?
Understanding the distinction helps align the budget with business value.
Basic vs Custom Power BI Dashboard Comparison
| Feature | Basic Dashboard | Custom Dashboard |
|---|---|---|
| Visual Design | Standard Templates | Tailored Visuals & Themes |
| Data Sources | Limited Connections | Multiple System Integrations |
| Automation | Manual Refresh | Real-Time or Scheduled |
| Scalability | Low | Enterprise-Level |
| Cost | Lower | Higher — Better ROI |
How Do Real-Time Power BI Dashboards Improve Decision-Making?

Live Power BI dashboards are no longer just a thing of the past; they also ensure your company reacts immediately.
On-the-fly Data synchronization
Information flows from sources to reports in real time, eliminating outdated numbers.
Automated Alerts and Triggers
Notifications can be fired when important thresholds are violated – action is taken in a timely manner.
Live Data Stream Predictive Insights
Predictive analytics for trend spotting can be used in advanced visualizations with real-time input.
Quickening of Response to Performance Problems
Tactics can be changed in real-time by the operational teams, e.g., staffing or promotion can be changed based on the current data on sales.
Why Work with Power BI Development Experts?
Power BI dashboards cannot be used like plug-and-play; they require technical expertise and strategic understanding.
Optimization and Efficient Data Modeling
The professionals can provide clean data structures that perform well even under high query loads.
Scalable and Secure Implementation
The professionals set governance, security and refresh policies, which are scaled according to the users.
Troubleshooting and After-Sales Support
The problem comes after deployment, such as performance tuning and permission errors, which demand hands-on knowledge.
Adherence to Corporate Data Policies
Experts ensure that there are security standards, data classification and access policies.
Need to make your reporting easier? Contact our Power BI development professionals to get a free consultation, or hire dedicated Power BI developers.
How to Reduce Power BI Dashboard Development Cost Without Compromising Quality
Smart budgeting does not imply cutting corners; it is just wise planning.
- Reuse Design Templates/ Visuals: Use ready-made layouts and theme sets to save on design time.
- Minimize Phase 1 Scope to Select KPIs: Establish MVP dashboards initially, then implement improvements.
- Start with Power BI Pro rather than Premium: Pro is a suitable, affordable option for small to mid-sized teams.
- Associate with Adaptable Pricing Vendors: Find BI partners with staged billing or fixed-scope estimates.
- Long-Term Cost Optimization Ideas: A periodic dashboard audit should be scheduled to avoid redeveloping in the future and keep the models lean and performant.
Power BI Dashboard ROI: What Returns Can You Expect?
BI has tangible and measurable ROI.
| Metric | Before BI Dashboard | After Implementation |
|---|---|---|
| Report Preparation Time | 6–8 Hours | 15 Minutes |
| Data Accuracy | ~70 % | ~95 %+ |
| Decision Speed | Slow | Instant |
| Cross-Team Alignment | Low | High |
Dashboards remove the manual assembly of reports, enhance the belief in data and create coherence, making decisions quicker.
When Should You Upgrade or Redesign Your Power BI Dashboards?
In some cases, dashboards become outdated faster than anticipated.
- Dashboards Are Sluggish to load: Slow performance is an indicator that the model is outdated or that queries are ineffective; it is time to redesign.
- Statistics are no longer a Reliable Indicator of New KPIs: Dashboards should be aligned with current goals as strategies change.
- Design of the Visual Content is Stagnant: A polished refresh is justified by new UI standards or accessibility requirements.
- New Insights are needed in Departments: When teams request new drill-downs or cross-functional measures, an upgrade should be considered.
Conclusion
Getting an estimate of the potential cost to develop a Power BI dashboard will help you better manage your budget and eliminate guesswork in your forecast.
Whether you plan to develop custom or real-time Power BI dashboards, Shiv Technolabs, an established Power BI development company, will make the difference. We provide scalable, secure, and ROI-driven BI solutions, from strategy and deployment through to beyond.
Efficient models, automation, and customized visuals provided by our Power BI development services will ensure prompt insights and minimal operational load.
Frequently Asked Questions (FAQs)
1. How much would an average Power BI dashboard cost to develop?
The most common prices range from $ 1,500 to $ 15,000 or more for real-time, enterprise-based scenarios. Pricing is affected by custom visuals, data sources and automation.
2. What are the drivers of Power BI dashboard pricing?
Integration complexity, number of visuals, automation requirements and maintenance are the largest cost drivers.
3. Is it more expensive to use real-time Power BI dashboards?
Yes – live dashboards require live connectors, API development and performance optimization, which increase development time but improve ROI through faster insights.
4. Is it possible to reduce Power BI dashboard development costs using templates?
Absolutely, in design templates and standardized visuals, it will save on set-up and testing time and on initial cost.
5. What is the time span for creating a Power BI dashboard?
Usually 2-6 weeks based on the complexity of data, user needs and sources.