Table of Contents
Many organizations choose a BI platform based on dashboards alone. Six months later, they discover expensive licensing, slow performance, disconnected data sources, or reporting processes that require constant technical support.
The right BI platform should do much more than create charts. It should connect your entire data ecosystem, support business users with self-service analytics, scale with your organization, and provide reliable insights that help teams act quickly.
If you are comparing Power BI, Tableau, and Looker, this guide explains where each platform performs best, where limitations appear, and which solution fits different business sizes, industries, and data strategies.
Quick Verdict: Which BI Tool Should You Choose Today?
Choose Power BI if you run on Microsoft and want the lowest entry price. Choose Tableau if visualization depth and analyst-led exploration matter most. Choose Looker if you need one governed metrics layer across many teams and apps.
There is no single winner. The right tool depends on your data warehouse, your team’s skills, and how many people consume reports.
| Business Situation | Recommended BI Platform | Why |
| Startup with limited budget | Power BI | Affordable licensing, Microsoft integration, fast deployment |
| Small and mid-sized business | Power BI | Easy adoption, strong Microsoft ecosystem, lower total cost |
| Data visualization and executive dashboards | Tableau | Industry-leading visual analytics and storytelling |
| Cloud-native SaaS business | Looker | Strong semantic layer and modern cloud architecture |
| Enterprise with governed data | Looker | Centralized data modeling and consistent metrics |
| Microsoft-first organization | Power BI | Native integration with Azure, Excel, SQL Server, Teams, and Microsoft Fabric |
| Data analyst-heavy organization | Tableau | Advanced visualization and interactive analysis |
| Multi-cloud analytics environment | Looker | Flexible integration with modern cloud data warehouses |
- Choose Power BI for affordability, Microsoft integration, and fast business adoption.
- Choose Tableau when visualization quality and interactive storytelling matter most.
- Choose Looker when centralized governance, cloud-native analytics, and scalable data modeling are business priorities.
Why Businesses are Choosing BI Tools Differently in 2026
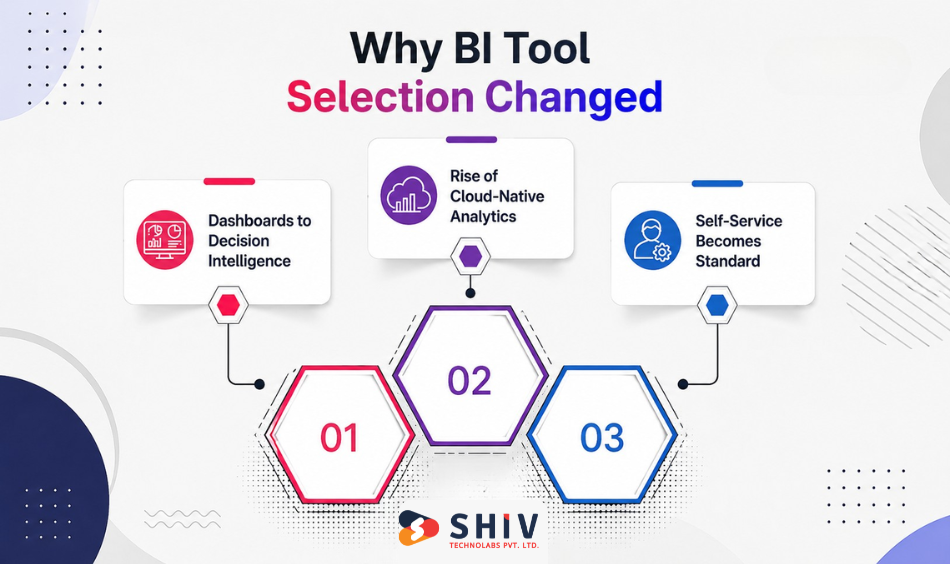
Business intelligence has changed significantly over the past few years. Organizations no longer evaluate BI platforms based only on dashboard quality. They now expect analytics platforms to support AI, automation, governance, cloud infrastructure, and faster decision-making. Several technology shifts are changing how companies evaluate modern data analytics tools.
# Shift from Dashboards to Decision Intelligence
Traditional dashboards showed historical reports. Modern BI platforms help users understand why something happened, predict what may happen next, and recommend possible actions.
Organizations increasingly expect BI platforms to provide:
- AI-assisted insights
- Natural language queries
- Predictive analytics
- Automated anomaly detection
- Decision recommendations
- Embedded business intelligence
Instead of asking analysts to build every report, business users expect answers immediately.
Microsoft continues expanding AI capabilities across Power BI through Microsoft Fabric and Copilot, while Tableau and Looker are also investing heavily in AI-assisted analytics.
# Rise of Cloud-Native Analytics Platforms
Modern organizations rarely keep all business data inside one database.
Modern analytics environments often combine:
- Cloud data warehouses
- SaaS applications
- ERP systems
- CRM platforms
- Marketing platforms
- eCommerce platforms
- Operational databases
Cloud-native BI platforms simplify reporting across multiple data sources without moving data unnecessarily. This explains why businesses increasingly evaluate BI tools based on architecture rather than dashboard appearance alone.
# Self-Service Analytics Is Becoming the Standard
Business users no longer want to wait days for reports. Marketing teams, finance managers, sales leaders, HR departments, and operations teams expect access to analytics whenever they need it.
Modern business intelligence platforms now focus on:
- Self-service dashboards
- Drag-and-drop reporting
- Natural language search
- Reusable datasets
- AI-assisted report generation
This reduces dependency on technical teams while improving decision speed.
Power BI vs Tableau vs Looker: Core Positioning
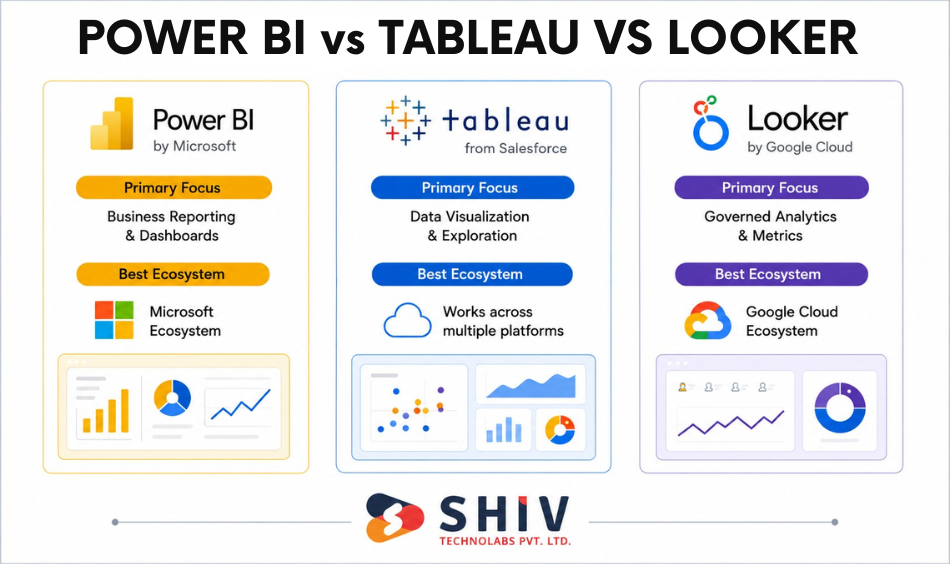
Although these platforms compete in the same market, each follows a different philosophy. Understanding their positioning makes the comparison much easier.
# Power BI: Built for the Microsoft Ecosystem
Power BI focuses on accessibility, affordability, and integration across Microsoft’s technology stack.
Its biggest strengths include:
- Microsoft 365 integration
- Excel compatibility
- Azure connectivity
- SQL Server support
- Microsoft Fabric ecosystem
- Affordable licensing
- Strong self-service reporting
Power BI is often the preferred option for businesses already using Microsoft technologies because users can transition with minimal learning effort. Organizations building enterprise reporting solutions often combine Power BI with custom software development services to create business-specific analytics portals.
# Tableau: Visualization-First Business Intelligence
Tableau, owned by Salesforce, leads with visual exploration. Instead of focusing primarily on Microsoft integration or semantic modeling, Tableau emphasizes interactive exploration and storytelling.
Its strengths include:
- Highly interactive dashboards
- Advanced visualizations
- Data storytelling
- Strong analyst workflows
- Rich chart library
- Flexible dashboard customization
Many analysts consider Tableau one of the strongest platforms for exploratory data analysis.
# Looker: Built Around a Semantic Data Model
Looker, part of Google Cloud, centers on a modeling layer called LookML. Instead of focusing on dashboard creation first, it emphasizes creating a centralized semantic model using LookML. This allows organizations to define metrics once and reuse them consistently across reports. It fits organizations that need a single source of truth.
Key strengths include:
- LookML semantic layer
- Cloud-native architecture
- Centralized governance
- Consistent business metrics
- Embedded analytics
- BigQuery integration
- API-first platform
This architecture is especially valuable for SaaS businesses and organizations managing large cloud data environments.
Key Differences of Power BI vs Tableau vs Looker
Power BI, Tableau, and Looker are all leading business intelligence platforms, but they are designed with different priorities in mind. The comparison below highlights the key differences to help you identify which platform best aligns with your business goals, technical environment, and analytics requirements.
| Area | Power BI | Tableau | Looker |
| Primary Focus | Business reporting – Creates interactive reports and dashboards for everyday business decisions. | Data visualization – Excels at exploring data through rich, interactive visualizations. | Governed analytics – Delivers consistent metrics using centralized data models. |
| Best Ecosystem | Microsoft – Best for organizations using Microsoft 365, Azure, or SQL Server. | Multi-platform – Connects easily with a wide range of data sources and cloud platforms. | Google Cloud – Built to work seamlessly with BigQuery and the Google Cloud ecosystem. |
| Learning Curve | Low – Easy for Excel and Microsoft users to learn. | Medium – Requires some experience to build advanced visualizations. | High – Best suited for teams familiar with SQL and data modeling concepts. |
| AI Features | Excellent – Includes Copilot, natural language queries, and automated insights. | Strong – Offers AI-assisted analytics and data explanations. | Strong – Leverages Google AI for conversational analytics and intelligent insights. |
| Data Modeling | Good – Supports robust data models with DAX and Power Query. | Moderate – Handles relationships well but offers less centralized modeling. | Excellent – Semantic modeling ensures consistent KPIs across the organization. |
| Dashboard Design | Very Good – Creates clean, interactive dashboards for business users. | Excellent – Industry-leading visualizations for deep data exploration. | Very Good – Focuses on clarity and governed reporting rather than advanced visuals. |
| Embedded Analytics | Good – Can embed reports into business applications and portals. | Good – Supports embedded dashboards with flexible integration options. | Excellent – Designed for embedding governed analytics into products and applications. |
| Enterprise Governance | Strong – Provides security, permissions, and centralized administration. | Strong – Offers enterprise-grade governance and access controls. | Excellent – Built around centralized metric definitions and strict data governance. |
| Cloud Readiness | Excellent – Supports cloud, hybrid, and on-premises deployments. | Excellent – Connects to virtually any cloud data platform. | Excellent – Cloud-native architecture optimized for modern data warehouses. |
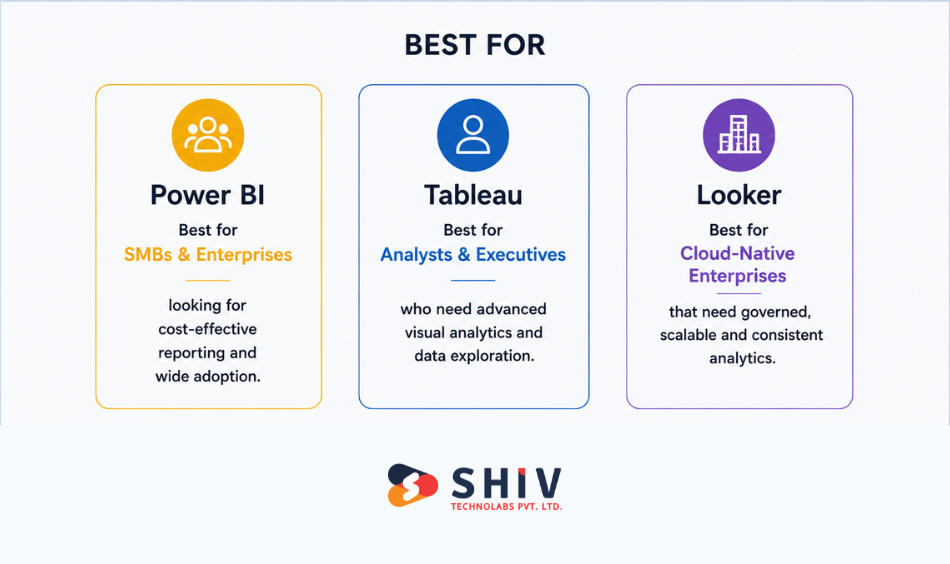
| Best For | SMBs & enterprises looking for cost-effective business intelligence and reporting. | Analysts & executives who need advanced visual analytics and interactive dashboards. | Cloud-native enterprises that prioritize governed, scalable, and self-service analytics. |
Data Architecture Differences Between Power BI, Tableau and Looker
Architecture determines how well a BI platform scales as your business grows. While dashboards are the visible layer, architecture influences reporting consistency, governance, performance, and maintenance. Understanding these architectural differences helps avoid expensive migrations later.
# Power BI Architecture: Optimized for the Microsoft Ecosystem
Power BI is designed around Microsoft’s analytics ecosystem.
It connects naturally with:
- Microsoft Fabric
- Azure Synapse
- Azure SQL
- SQL Server
- Microsoft 365
- Excel
- Dataverse
- Dynamics 365
Power BI stores imported datasets using the VertiPaq in-memory engine, which delivers fast report performance for most business scenarios. Organizations can choose between import mode, DirectQuery, live connection, and composite models. This flexibility allows businesses to balance performance with real-time reporting requirements.
See how BI supports growth in our SaaS business intelligence guide.
# Tableau Architecture: Built Around Visual Analytics
Tableau follows a visualization-first architecture. It pairs its VizQL engine with the Hyper in-memory data engine. Instead of emphasizing centralized semantic modeling, Tableau focuses on enabling analysts to connect, explore, and visualize data from many sources quickly.
Supported connections include:
- Snowflake
- AWS Redshift
- Google BigQuery
- Oracle
- PostgreSQL
- SQL Server
- SAP
- Salesforce
Tableau supports both live connections and data extracts. Live connections keep dashboards connected directly to source systems. Extracts improve dashboard performance by storing optimized snapshots of the data. This flexibility makes Tableau attractive for organizations handling diverse reporting requirements.
# Looker Architecture: Built Around the Semantic Layer
Looker approaches analytics differently from Power BI and Tableau. Instead of building dashboards directly from raw data, Looker introduces a semantic modeling layer called LookML.
LookML defines:
- Business metrics
- Relationships
- Calculations
- Dimensions
- Security rules
- Data definitions
Once defined, these metrics become reusable across every report.
For example:
Revenue means the same thing across:
- Finance dashboards
- Marketing reports
- Executive dashboards
- Sales analytics
It solves a common enterprise reporting problem by ensuring all departments calculate the same KPIs consistently.
Looker’s architecture works particularly well with:
- BigQuery
- Snowflake
- Amazon Redshift
- Databricks
- PostgreSQL
- Cloud SQL
Ease of Use vs Technical Depth
Every BI platform balances usability and technical flexibility differently. Some organizations want every employee to build reports. Others prioritize centralized governance and engineering-led analytics. Understanding your team’s technical skills is just as important as comparing features.
# Power BI for Business Users
Power BI has one of the shortest learning curves among enterprise BI platforms. Business users familiar with Excel usually adapt quickly because many concepts feel familiar.
Power BI supports:
- Drag-and-drop reporting
- Natural language queries
- Excel integration
- Microsoft Teams integration
- AI-assisted report generation
- Interactive dashboards
This makes it an excellent self-service BI platform. Organizations implementing internal reporting portals often combine Power BI with AI/ML development services to generate predictive insights alongside operational dashboards.
# Tableau for Analysts and Data Storytelling
Tableau requires slightly more experience than Power BI, but it rewards analysts with exceptional flexibility.
Analysts can create:
- Interactive dashboards
- Advanced calculations
- Geographic maps
- Statistical visualizations
- Story-driven presentations
- Executive dashboards
Its visual capabilities remain one of Tableau’s strongest competitive advantages. Organizations presenting data to executives often prefer Tableau because storytelling becomes part of the reporting experience.
# Looker for Engineering-Driven Analytics
Looker has the steepest learning curve because it introduces LookML. Data engineers typically define business metrics first. Business users then consume trusted reports without rebuilding calculations repeatedly.
Advantages include:
- Centralized metric definitions
- Consistent reporting
- Strong governance
- Reduced reporting errors
- Better collaboration between engineering and business teams
This model requires more technical investment initially, but often scales better across enterprise environments.
# Which Platform Is Easier?
| User Type | Recommended Platform | Reason |
| Business executives | Power BI | Fast adoption and simple dashboards |
| Department managers | Power BI | Self-service reporting with minimal training |
| Business analysts | Tableau | Rich visual exploration and dashboard flexibility |
| Data scientists | Tableau | Strong analytical capabilities |
| Data engineers | Looker | Centralized semantic modeling |
| Enterprise data teams | Looker | Consistent metrics and governance |
| Microsoft organizations | Power BI | Native ecosystem integration |
| Cloud-native SaaS companies | Looker | Cloud-first architecture and governance |
Pricing & Total Cost of Ownership (TCO)
Pricing models differ enough that headline rates can mislead. Always model your real user mix and data costs. Understanding these costs helps businesses choose the right analytics platform for long-term growth.
| Tool | Entry seat | Mid / advanced | Enterprise / scale |
| Power BI | Pro $14/user/mo | PPU $24/user/mo | Fabric capacity from about $262/mo (F2); F64 about $5,250/mo |
| Tableau (Cloud) | Viewer $15/user/mo | Explorer $42, Creator $75/user/mo | Enterprise: Viewer $35, Explorer $70, Creator $115; Tableau+ quote-based |
| Looker | Quote-based | Viewer about $400/yr, Standard user about $799/yr | Platform from about $66,600/yr (Standard) to about $198,000/yr (Embed) |
# Power BI Pricing Model
Power BI offers one of the most affordable entry points among enterprise BI platforms. Primary licensing options include:
- Power BI Free
- Power BI Pro
- Power BI Premium Per User (PPU)
- Microsoft Fabric Capacity
Power BI becomes especially cost-effective for organizations already licensing Microsoft 365.
Power BI Pro costs $14 per user per month and Premium Per User costs $24, set in April 2025 and unchanged in 2026, per Microsoft’s pricing. At Microsoft Fabric F64 (about $5,250 per month), report viewers need only a free license, and Copilot becomes available. Microsoft 365 E5 includes Pro at no extra cost. For better cost insights, read our guide on Power BI dashboard development cost.
# Tableau Pricing Structure
Tableau provides role-based licensing. Common license types include:
- Viewer
- Explorer
- Creator
Pricing varies depending on deployment and licensing model. Organizations requiring advanced dashboard development often invest in creator licenses for analysts while providing viewer access to executives.
Tableau Cloud Standard lists Creator at $75, Explorer at $42, and Viewer at $15 per user per month, billed annually. Enterprise raises these to $115, $70, and $35. AI features can be found in the Tableau+ bundle, which is quote-based. See Tableau’s pricing for current tiers.
# Looker Enterprise Pricing
Looker uses platform fees plus per-user licensing, and pricing is quote-based through Google Cloud sales.
Pricing depends on:
- Data usage
- Platform size
- User volume
- Cloud infrastructure
Enterprise requirements Marketplace figures suggest a standard platform near $66,600 per year, with viewer seats around $400 per year. AI usage is metered separately. See Looker pricing.
Data Integration with Modern Data Stacks
Integration strength often decides the winner. Pick the tool that fits your existing stack.
# Power BI integrations (Azure, Excel, SQL Server)
Power BI connects deeply across Microsoft services and Fabric. It also reads hundreds of third-party sources. Teams on Azure and Microsoft 365 get the smoothest path.
# Tableau integrations (Snowflake, AWS, BigQuery)
Tableau ships one of the broadest connector sets in BI. It works well with Snowflake, AWS, BigQuery, and Salesforce data. This breadth suits mixed, multi-cloud environments.
# Looker integrations (BigQuery, cloud-native stack)
Looker is built for cloud warehouses and runs natively on Google Cloud. It pairs especially well with BigQuery. It queries the warehouse live rather than copying data.
AI, Automation & Predictive Analytics
AI is now a core buying factor, and each vendor took a different route. Budget for AI as a separate line, because it often costs extra.
# Power BI AI capabilities
Power BI Copilot writes report summaries, builds visuals from prompts, and answers questions in natural language. Copilot needs Fabric F64 or higher capacity or a Premium Per User license. It also supports narrative insights and quick measurement suggestions.
# Tableau AI-driven insights
Tableau Pulse tracks key metrics and surfaces changes automatically. Tableau Agent answers questions in plain language, and Tableau Next adds agentic analysis. These sit in the Tableau+ bundle tied to Salesforce Einstein and Agentforce.
# Looker semantic intelligence layer
Gemini in Looker powers Conversational Analytics, which turns plain-language questions into governed queries. Because answers run through the LookML model, they stay grounded in defined metrics. Google reports the semantic layer cuts errors in natural-language queries by a large margin. Organizations modernizing enterprise reporting frequently combine Looker with AI development services to build intelligent analytics ecosystems.
Best BI Tool by Business Size & Industry
The right choice depends on your company size, existing technology stack, reporting maturity, and long-term analytics goals. The following recommendations simplify the decision based on real-world business scenarios.
# Startups: Power BI or Looker Studio
Startups need low cost and fast setup. Power BI Free and Pro, or the lightweight Looker Studio, get teams reporting quickly. Heavy modeling can wait.
# SMBs: Power BI or Tableau
Growing teams want self-service without a large admin burden. Power BI fits Microsoft shops, while Tableau suits teams that value visual exploration. Both scale with the business.
# Enterprises: Tableau or Looker
Large organizations need governance and scale. Tableau leads on visual analysis, while Looker leads on a central metrics layer. The choice follows your data warehouse and team skills. Organizations modernizing enterprise reporting frequently combine Looker with AI development services to build intelligent analytics ecosystems.
# SaaS companies: Looker
SaaS teams often embed analytics in their product. Looker’s modeling layer and embedding fit customer-facing dashboards. Model warehouse costs carefully at high user counts.
Real-Time Analytics & Performance
Speed depends on architecture and data volume. Test with your own data before you commit.
# Power BI real-time reporting
Power BI supports streaming datasets and live DirectQuery. Direct Lake on Fabric reads from OneLake for fast performance on large models. This narrows the old gap with warehouse-native tools.
# Tableau performance with large datasets
Tableau’s Hyper engine handles large extracts well and keeps interactions fast. Live connections push queries to the source. Performance tuning still matters at large scale.
# Looker Real-time Cloud Architecture
Looker queries the warehouse directly, so freshness depends on your warehouse. Numbers stay current without extract refresh jobs. Warehouse query costs rise with heavy usage, so plan for that.
Security, Governance & Scalability
Governance separates a tidy rollout from a sprawl of conflicting numbers. Each tool handles it differently.
# Power BI Governance Model
Power BI offers row-level security, sensitivity labels, and tenant controls. Governance grows stronger inside Microsoft Fabric. It fits organizations already using Microsoft compliance tools.
# Tableau Security Framework
Tableau provides row-level security and permissions with advanced governance at the enterprise tier. Centralized data policies and management controls require a higher tier. Plan the tier you need early.
# Looker Centralized Governance Advantage
Looker enforces metric definitions in LookML, so every team queries the same logic. This central model is its core governance strength. It reduces conflicting numbers across departments.
When Each BI Tool Wins (Decision Framework)
Rather than asking which platform is best overall, ask which platform best fits your business goals.
# Choose Power BI When
Power BI is the strongest option when affordability, Microsoft integration, and self-service reporting are your priorities.
Power BI performs best if you:
- Already use Microsoft 365
- Store data in SQL Server or Azure
- Need affordable licensing
- Want business users to build reports
- Need fast implementation
- Require strong AI features through Microsoft Fabric
Power BI offers excellent value for organizations looking to expand analytics without significantly increasing software costs.
# Choose Tableau When
Tableau stands out when visualization quality and data exploration drive business decisions.
It is a better fit if you:
- Have experienced analysts
- Build executive dashboards
- Present insights to stakeholders frequently
- Need advanced charting capabilities
- Analyze large and varied datasets
- Prioritize visual storytelling
Tableau helps transform complex datasets into clear business narratives.
# Choose Looker When
Looker becomes the preferred option when governance, cloud architecture, and centralized metrics are business priorities.
Choose Looker if you:
- Operate in Google Cloud
- Use BigQuery or Snowflake
- Require consistent KPIs across departments
- Need embedded analytics
- Build SaaS products
- Want scalable semantic modeling
Looker reduces reporting inconsistencies by centralizing business logic.
Common Mistakes When Choosing a BI Tool
Many organizations evaluate BI platforms based on feature lists instead of long-term business requirements. Avoiding these common mistakes can save both time and implementation costs.
# Choosing Based Only on Visuals
Visual dashboards attract attention, but they should not be the only deciding factor. Before choosing a platform, evaluate its data architecture, governance, integration capabilities, scalability, security, and licensing costs. A visually impressive dashboard delivers little value if the underlying data cannot be trusted.
# Ignoring Data Warehouse Strategy
Your BI platform should complement your existing data architecture rather than require unnecessary changes. Consider where your data is stored today, whether you plan to migrate to the cloud in the future, the data warehouse technologies you already use, your ETL processes, and how frequently your data needs to be refreshed. Choosing a platform that aligns with your data strategy reduces migration complexity and makes future scaling much easier.
# Underestimating Future Growth
Many businesses choose reporting tools that meet their current needs but struggle as data volumes, users, and reporting requirements grow. Think beyond today’s requirements by considering whether the platform can support additional users, new departments, expanding business units, larger datasets, AI-powered analytics, and embedded reporting. A scalable BI platform helps avoid costly migrations and system replacements as your business evolves.
# Ignoring Team Skills
Even the most powerful BI platform delivers value only when your team can use it effectively. Consider who will build dashboards, maintain data models, manage the platform and whether business users need self-service reporting capabilities. It’s also important to assess if your organization has the necessary data engineering expertise. Selecting a platform that matches your team’s technical skills leads to faster adoption and better long-term success.
# Overlooking Governance
As analytics adoption grows, governance becomes essential for maintaining accurate and reliable reporting. Without clear governance policies, organizations often end up with conflicting KPIs, duplicate dashboards, inconsistent reports, security vulnerabilities, and poor data quality. Implementing strong governance from the beginning helps maintain reporting accuracy, protects sensitive business data, and ensures everyone works with consistent, trusted information.
What are the Common BI Trends Shaping Modern Business
Business intelligence continues evolving rapidly. Several trends are influencing how organizations evaluate analytics platforms today.
# AI-Powered Decision Intelligence
Modern BI platforms increasingly provide recommendations instead of static reports.
Users expect AI to:
- Explain trends
- Detect anomalies
- Predict outcomes
- Recommend actions
- Generate reports automatically
Decision intelligence is becoming a core differentiator across BI platforms.
# Embedded Analytics in SaaS Platforms
Organizations increasingly integrate dashboards directly into applications rather than asking users to open separate BI tools.
Embedded analytics helps:
- SaaS platforms
- Customer portals
- ERP systems
- CRM platforms
- Internal business applications
Businesses building analytics-enabled applications often combine BI platforms with enterprise software development services.
# Unified Data Platforms Replacing Dashboards
Companies increasingly prefer unified platforms where data integration, storage, governance, AI, and reporting work together.
Examples include:
- Microsoft Fabric
- Google Cloud Data Platform
- Snowflake ecosystem
This reduces operational complexity while improving data consistency.
# Self-Service Analytics Growth
Business users expect analytics without depending on technical teams.
Future BI platforms will continue expanding:
- Natural language queries
- AI-assisted reporting
- Automated dashboard creation
- Guided analytics
- Conversational BI
These capabilities will make analytics more accessible across every department.
Final Decision Framework: How to Choose the Right BI Tool
Choosing the right BI platform becomes easier when you evaluate your business across four key areas. Answer these questions to identify the platform that best supports your reporting strategy today and your growth plans for the future.
# 1. How Mature Is Your Data Environment?
Your current data infrastructure plays a major role in selecting the right BI tool.
- Power BI is a great choice for businesses that are beginning their analytics journey or have data spread across multiple systems.
- Looker works best for organizations with a well-established cloud data warehouse and centralized data strategy.
- Tableau fits businesses that rely heavily on interactive analysis and data visualization, regardless of data maturity.
# 2. What Skills Does Your Team Have?
Choose a platform your team can adopt and manage effectively.
- Power BI is ideal for teams familiar with Excel and other Microsoft products.
- Tableau suits data analysts who regularly build dashboards and perform detailed visual analysis.
- Looker is a strong option for organizations with data engineers or analytics teams managing semantic models and cloud-based data platforms.
# 3. Which Technology Ecosystem Do You Use?
Your existing technology stack should work naturally with your BI platform.
- Power BI integrates seamlessly with Microsoft 365, Azure, SQL Server, and Microsoft Fabric.
- Looker is the preferred choice for businesses using Google Cloud, BigQuery, and other cloud-native services.
- Tableau offers broad compatibility with multiple cloud providers, databases, and enterprise applications, making it suitable for mixed technology environments.
# 4. How Much Do You Expect Your Analytics to Grow?
Think beyond current reporting needs and choose a platform that can scale with your business.
- Power BI delivers excellent value for organizations with growing user bases while keeping licensing costs manageable.
- Looker is built for enterprises that need centralized governance, consistent metrics, and scalable cloud analytics.
- Tableau scales well for organizations with large analyst teams that require advanced visualization and interactive reporting across departments.
How Shiv Technolabs Helps You Choose and Implement the Right BI Tool
The tool is only half the project. Clean data, a sound model, and a smooth rollout decide whether dashboards get used. Shiv Technolabs helps with both the decision and the build.
Our team runs tool selection, data modeling, dashboard development, and integration across all three platforms. Explore our comprehensive services, including:
- Data analytics services for end-to-end BI delivery. For Microsoft-first teams
- Power BI development services cover dashboards, DAX, and Fabric.
- You can also hire dedicated Power BI developers for ongoing work or scope wider automation through our Power Platform consulting.
Conclusion
Power BI, Tableau, and Looker each win for different teams. Power BI offers the lowest entry cost and the tightest Microsoft fit. Tableau leads on visual depth and analyst-driven exploration. Looker delivers governed, consistent metrics across a cloud-warehouse stack.
Start with your data warehouse, your team’s skills, and your viewer count. Model the full cost, including AI usage and warehouse queries. Then pick the tool that fits your stack today and your roadmap for the next three years.
FAQs
# Which is better, Power BI, Tableau, or Looker?
No tool wins for everyone. Power BI fits Microsoft Teams and tight budgets. Tableau suits deep visual analysis. Looker fits governed metrics in a cloud warehouse. Choose based on your data stack, team skills, and how many people will consume reports.
# Is Power BI cheaper than Tableau and Looker?
Yes, Power BI usually has the lowest entry cost. Pro is $14 per user per month in 2026. Tableau Viewer starts at $15, and Creator at $75. Looker is quote-based and generally the most expensive, with platform fees plus per-user licensing.
# Which BI tool has the best AI features in 2026?
Each tool offers strong AI. Power BI Copilot writes summaries and builds visuals. Tableau adds Pulse, Agent, and agentic analysis through Tableau Next. Looker’s Gemini powers conversational analytics grounded in its semantic model. The best fit depends on your platform and governance needs.
# Do I need a data warehouse to use these tools?
Not always. Power BI and Tableau can import or extract data directly. Looker requires a cloud warehouse like BigQuery or Snowflake, since it queries the warehouse live. Your warehouse strategy should guide which tool fits your team best.
# Which BI tool is best for enterprises?
Large organizations usually choose Tableau or Looker. Tableau leads on visual analysis and stakeholder reporting. Looker leads on a central metrics layer that keeps numbers consistent across teams. Power BI also scales well, especially for Microsoft-first enterprises using Fabric capacity.
# Can I use more than one BI tool?
Yes, some enterprises run a hybrid stack. Looker can govern metrics while Power BI or Tableau handles reporting and visuals. This adds cost and complexity. Use a multi-tool approach only when one platform cannot meet every need.
# Which BI tool is easiest to learn?
Power BI is the easiest for most business users, especially Excel users. Tableau is approachable for analysts but takes time to master. Looker has the steepest curve because it needs LookML modeling skills and data engineering support.
# How do I choose between Power BI, Tableau, and Looker?
Start with four questions. What cloud do you run on? How skilled is your team? How many people will view reports? What is your total budget, including AI and warehouse costs? Your answers point to the tool that fits your stack and roadmap.